
Are you working in the Kubernetes space and looking for a way to tie together your monitoring tools like Prometheus and Grafana? I took Robusta for a spin and here’s what I discovered.
I’ve been working on some kind of technology for over 20 years now (don’t ask how long), and one of the things that has always been a challenge is monitoring of resources. While the tools have evolved from Nagios, Cacti, and even- god forbid- SCOM, the actual challenges have been roughly the same. Here are the big ones for me:
Most solutions try to do everything for you, and usually that means they don’t do any of it particularly well. For instance, when I was working as a consultant setting up System Center Operations Manager, you would first deploy the service (no small feat in itself), enroll a bunch of servers, and install even more management packs.
Immediately, you would be overwhelmed with a sea of red alerts telling you about all the things that were wrong with your environment. 90% of the alerts were false positives, rendering the whole installation completely useless until you spent months tuning it. It’s not that the alerts were necessarily wrong, it’s just that the defaults of the management packs were a bit too aggressive or not context aware.
And context really is key here. The errors I used to get out of SCOM or vRealize were often not helpful, and they didn’t provide or understand the larger context of the environment they were functioning in. That made tracing down root cause a real challenge as I waded through a fog of alerts, playing whack a mole with false positives.
Once I did find the issue, I needed to know what to do. In the early days of monitoring, you had your Google-Fu and internal knowledge base to go off, but now I would expect any modern monitoring tool to provide me with a knowledge base article or even a best practice guide.
A complete monitoring system needs to be simple to setup, understand context, and provide helpful insight. Does it sound like I’m asking a lot of a single solution? That’s because I am. And maybe the answer is not a single solution, but a collection of tools that work together to provide a complete solution.
One of the key tenets of Linux is creating small tools that do one thing well, and then stringing those tools together to create a complete solution. We can extend the Linux philosophy to Kubernetes, since it was certainly founded in that environment.
I think a lot of people view Kubernetes as a developer-centric solution, and in many ways it is. But it’s important to remember that Kubernetes is a platform for running applications, and that is an operational task. K8s is Ops by design, with a developer friendly API.
Bearing that in mind, what do us Ops folks need to monitor?
And any other custom resources you might have deployed. It’s also unlikely there’s only one cluster in most organizations. We need to be able to monitor multiple clusters and possibly compare them to each other, especially when you have dedicated clusters for dev, staging, and production.
What tools do we have to help us with this? Most commonly, we have Prometheus to collect metrics, Grafana to visualize them, and AlertManager to notify us when things go wrong. But we still need something to investigate the problem, provide context, and possibly automate a solution. One potential tool is Robusta.
Robusta is both an open-source project and the company who created it. I want to focus on the open-source project first, and then we can cover the commercial offering.
The central goal of Robusta is to take the alerts fired off by AlertManager, enhance those alerts with data from Kubernetes, and then produce events that can be sent to a notification system. Out of the box it includes a set of rules for common issues to watch, and you can also create your own rules. Why don’t we walk through an example of deploying a crashing pod and see how Robusta reacts?
I have two AKS clusters running in my Azure subscription, with Robusta deployed on both using Helm. You can try this out for yourself by running through the demo files in my GitHub repository.
I’ve deployed a crashing pod to the first cluster using the commands stored in the crashing_pod directory. After running the apply command, we now have a pod that will crash every time it runs, creating a crash loop backoff.
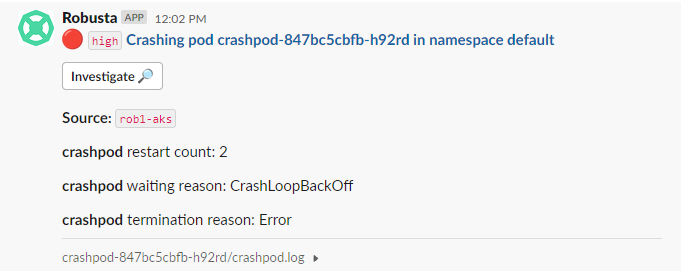
I’ve got Robusta wired into my Slack team, so I get a notification from Robusta when the pod crashes, on a channel I configured earlier. In the notification, I get the name of the cluster, the pod, the namespace, etc. It also includes the logs from the pod, so I don’t have to grab them myself.
Clicking on Investigate takes me to the Robusta dashboard where I can see a timeline of issues based on the pod.
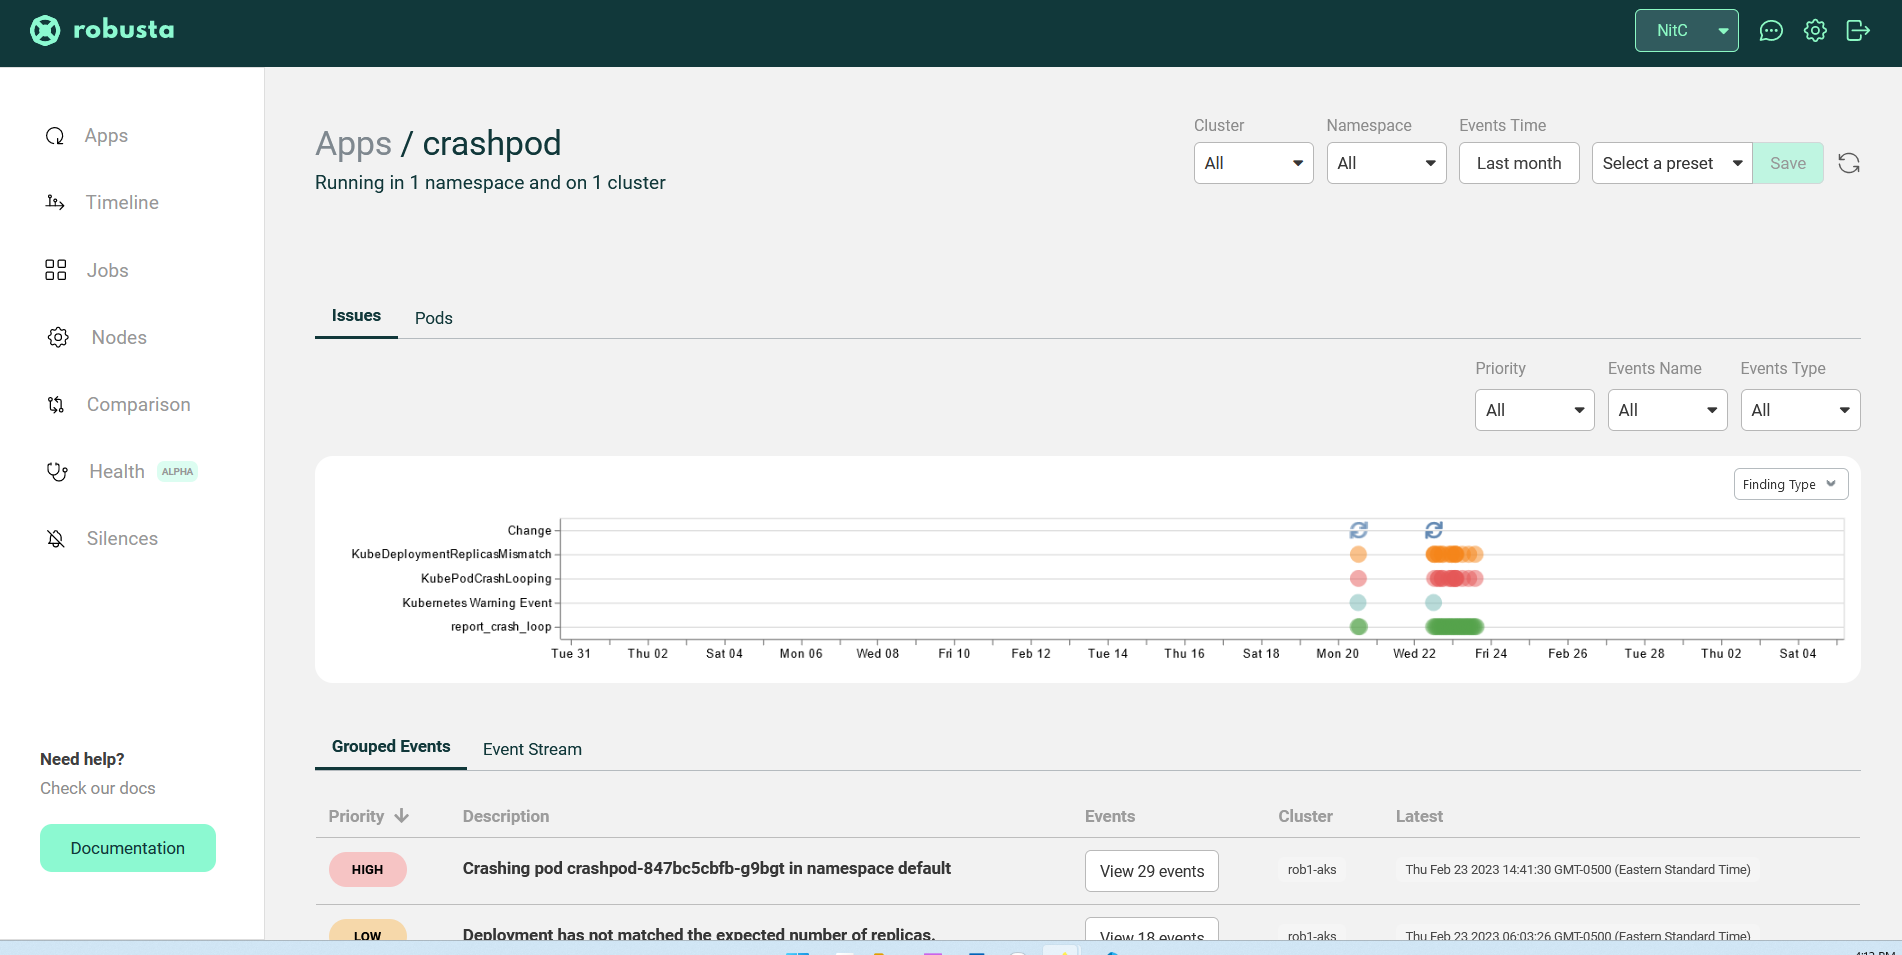
This gives me a bunch more context about the application, namespace, and cluster. I know the pod is crashing by design, but this could also show me in the timeline that the pod crashes every hour for some unknown reason. Or that the crash correlates with some other event in the environment.
Since we’re here, let’s dig into a few other features.
Before we get too far into the dashboard, I want to mention that we are now wading into the commercial and closed-source side of Robusta. The open-source version includes alert and log correlation, additional context, notification routing like we saw in Slack, the automation engine, and multi-cluster support.
Their SaaS dashboard is free for up to 20 nodes, which is plenty for a small cluster, but if you want to go beyond that scale, then you’ll need to upgrade to the paid version. There’s also an enterprise option to host your own instance of the Robusta UI, if SaaS doesn’t work for your organization.
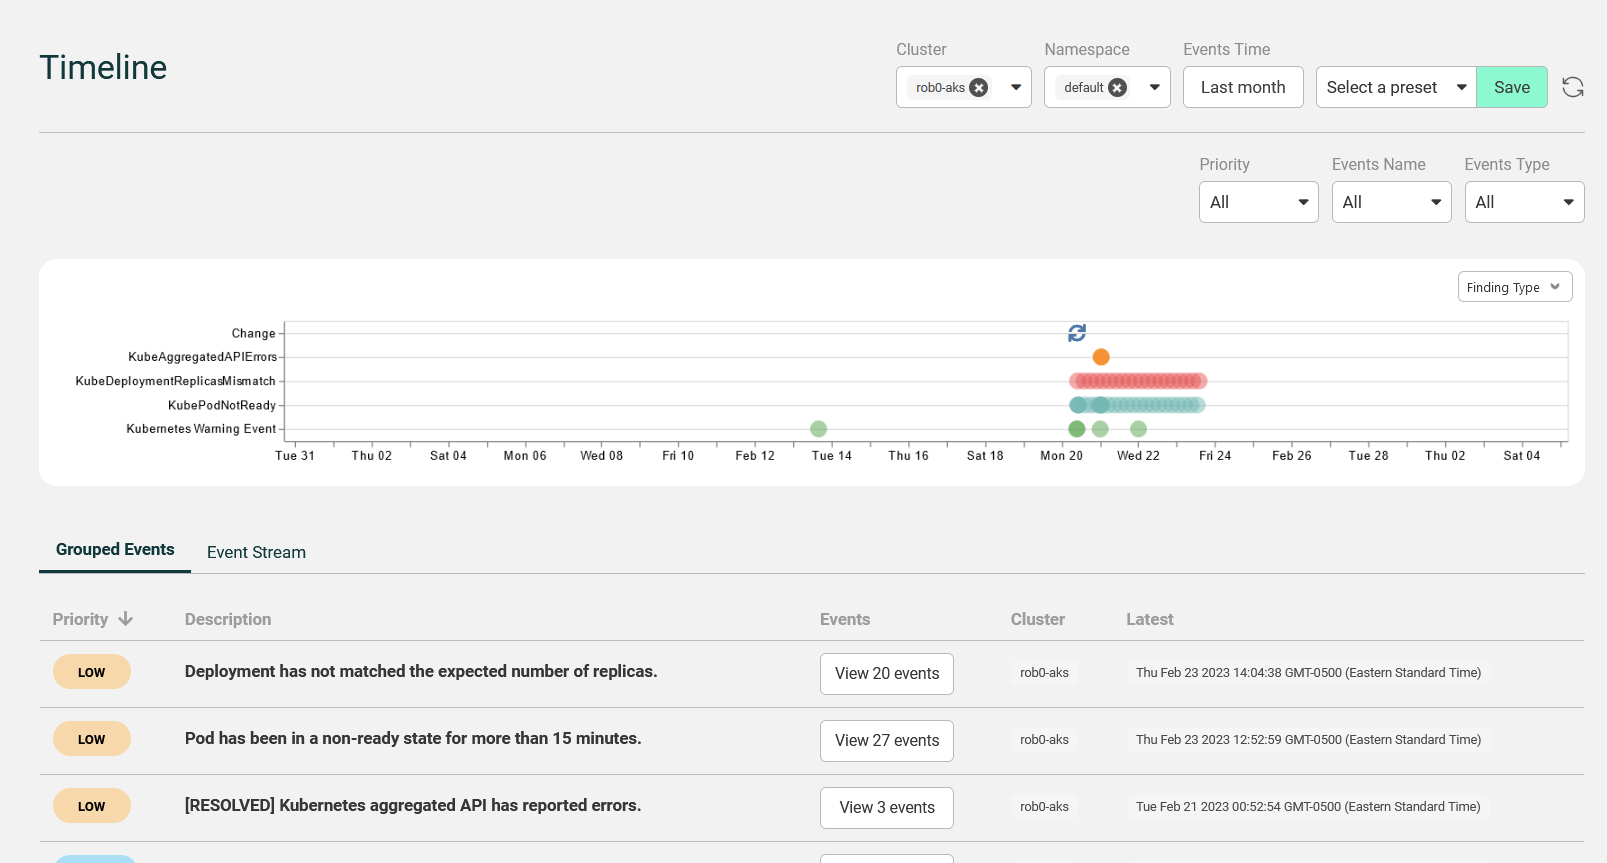
Here in the UI, I can check out the timeline for the entire cluster and create a customized view based on an application, cluster, and namespace and save it as a preset.
There’s another feature in the UI that I find extremely useful, the Comparison section.
Let’s say I’ve got two clusters, one for development and one for production, both with the same application deployed. Ideally, I want the two environments to closely mirror each other, and if there are differences I want to be able to spot that quickly. That’s exactly what the comparison feature does. I can compare namespaces from the same or different clusters, view the resources in each, and toggle a button to see only differences.
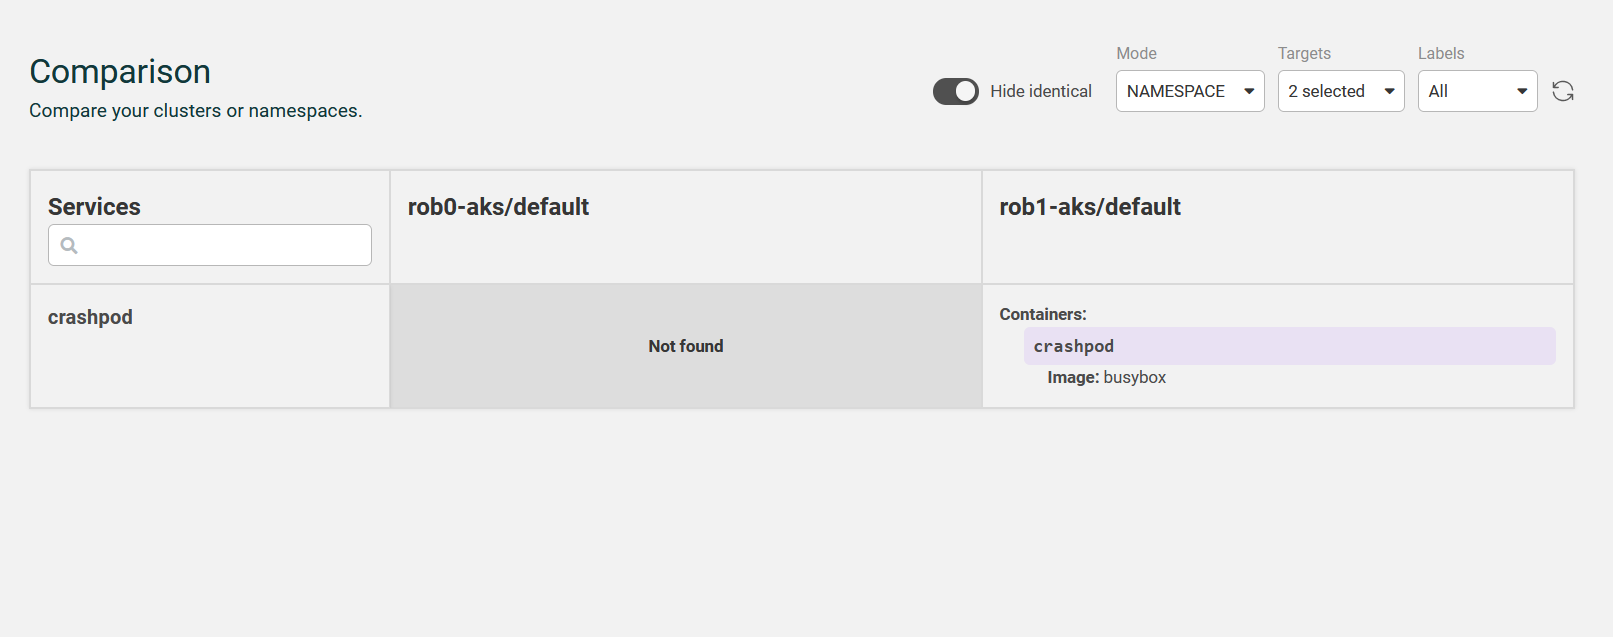
If you’re trying to determine drift between clusters, this is an essential feature.
I mentioned earlier that the open-source version of Robusta includes built-in rules. But it’s more than just sending an alert with some info, there’s a sneaky automation engine under the hood.
Okay, it’s not that sneaky, but hear me out. The rules are housed in Robusta playbooks and they are composed of a trigger and actions. The output of an action can be send to a destination called a sink. The trigger determines when the rule is fired, the actions are the things that should happen, and the sink is where the output of the actions should go.
You can trigger on an event from the Kubernetes API server, Prometheus and AlertManager, on a schedule, from a webhooks and more. The webhook option means you can trigger on just about anything, including your own custom events.
Moving to actions, Robusta comes with a set of built-in actions it can take, but you can also write your own custom actions in Python and have them run as well.
The sinks are targets for your output, and there are a lot of possible sinks. You’ve already seen Slack, and you can also add Teams, PagerDuty, Jira, and more; really if the target has a webhook, you can send data there.
This means the automation engine is ridiculously extensible and customizable. Robusta begins with useful defaults, but you can easily add your own triggers, actions, and sinks to make it do whatever you need it to do. And there’s a community of people who are doing just that and sharing their work. One fun example to play with is Robusta’s implementation of a ChatGPT enhanced bot. You can check out the code on GitHub.
As I mentioned earlier in the post, I’ve put together a repository that uses Terraform (what else would I use?) to deploy two AKS clusters and install Robusta using Helm. It also includes some scripts for deploying differnt applications, including the crashing pod you saw earlier; a full blown twelve-factor, polyglot app app with a traffic generator; and a basic PHP app with a load generator. That should give you plenty to play with and break to see how Robusta handles it.
I’ve barely scratched the surface on Robusta, but my main takeaway is that it’s a solid tool that serves a scoped purpose really well. At its core, it’s a rule processing engine that loves Kubernetes. It takes what Prometheus collects, info from Grafana, alerts from AlertsManager and makes that information more useful to the poor Ops folks who have to deal with it.
Having been one of those poor Ops people on more than one occasion, I appreciate the context added to alerts. I also appreciate that the automation component is open-source and extensible without using some arcane language or needing to compile binaries in Visual Studio (SCOM!). If you know a little Python, you’re good to go.
Of course, I don’t know Python all that well, so I’d love to see a low-code/no-code alternative for the Playbook creation. I’d also love to see some integration with the application level of running pods that have been instrumented with OpenTelemtry. Maybe that already exists and I haven’t seen it yet, or maybe that’s beyond what Robusta wants to focus on. I do appreciate focusing on a core problem and delivering a solution that solves it well.
Thanks to Robusta for sponsoring this post and thanks to you for reading! If you have any questions or comments, please reach out on Twitter or LinkedIn.
May 23, 2026

May 4, 2026


